Queries Screen for GirdGain 8 Clusters
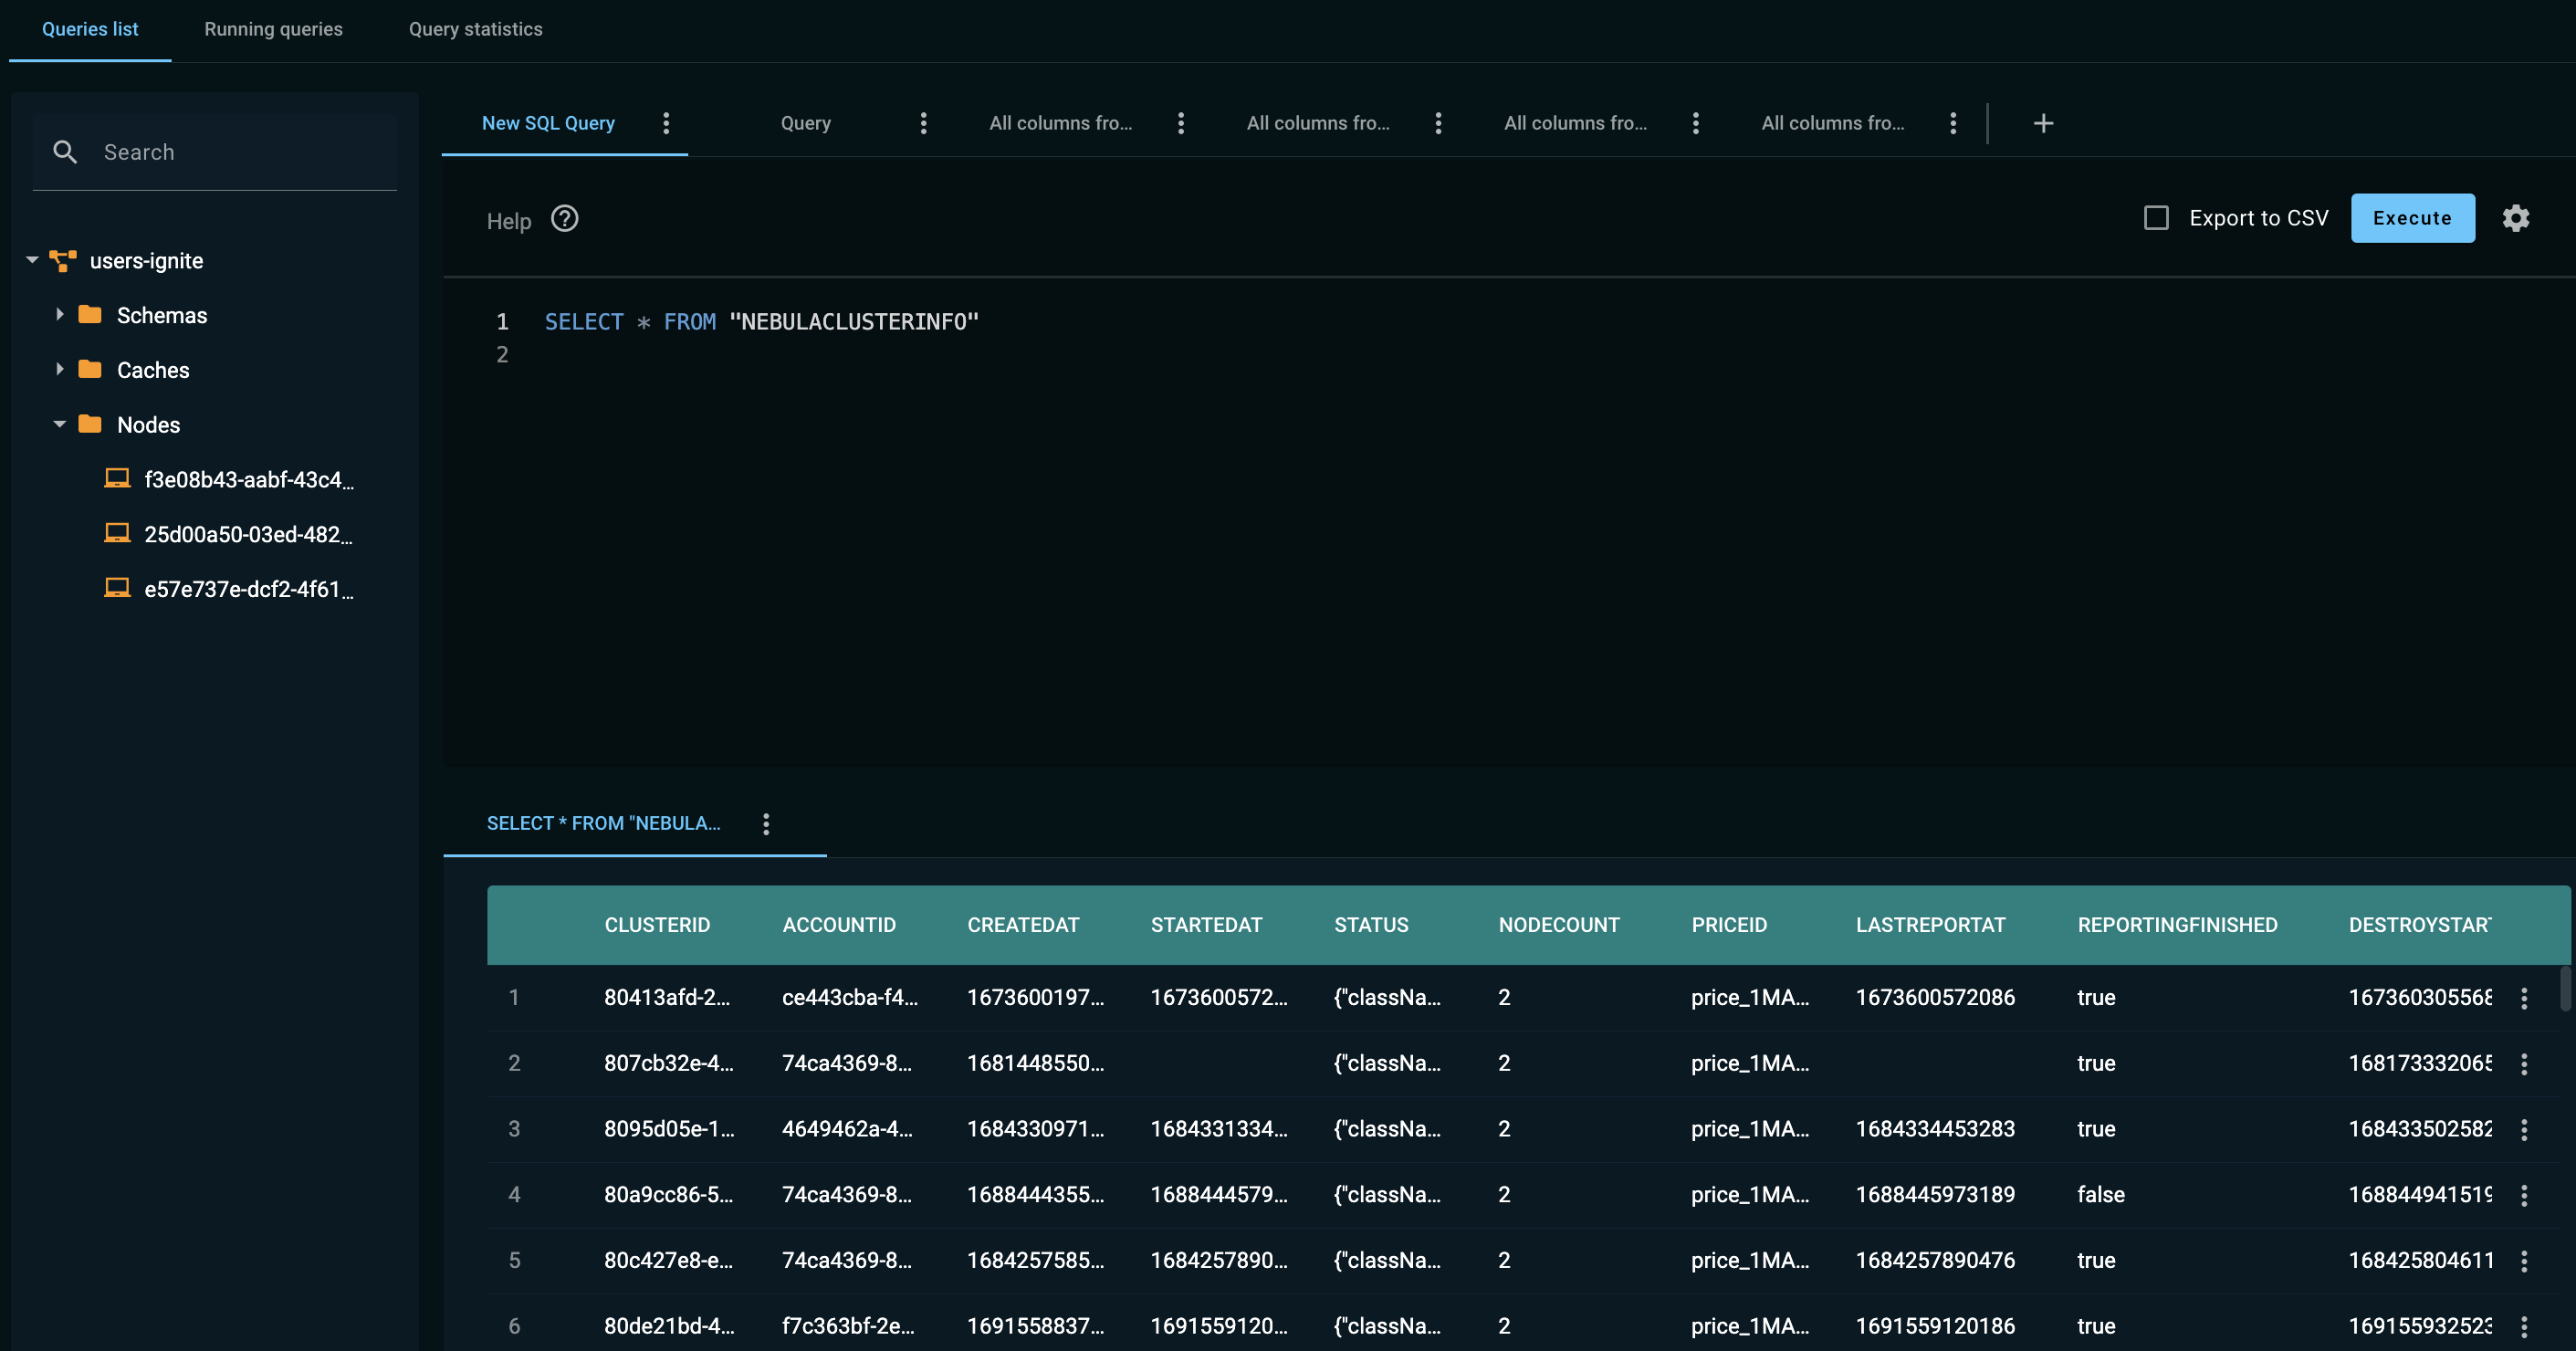
TThe Queries screen allows you to execute SQL queries against the GridGain 8 (Apache Ignite 2) cluster and view results. You can also view running queries and query statistics.

Overview of Queries Screen
The Queries screen consists of three tabs:
-
Queries list — execute SQL queries
-
Running queries — view the list of running queries
-
Query statistics — view query statistics
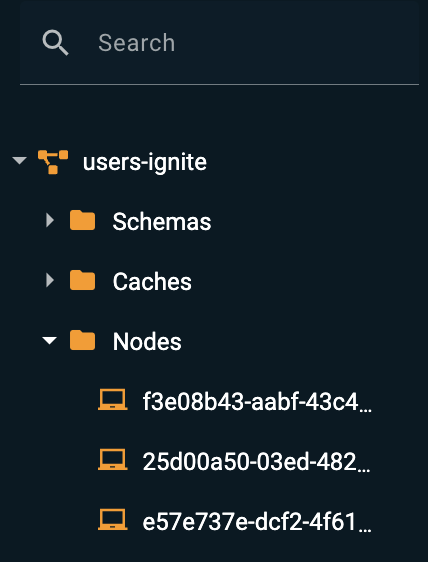
The Queries list tab displays the Search tree that lets you view the tables, caches, and nodes that are available in the cluster.

The tree consists of the following branches:
-
The Schemas branch contains the SQL tables.
-
The Caches branch contains the names of the caches.
-
The Nodes branch contains node IDs. You can execute a SQL query on a specific node.
Executing Queries
SQL Queries
Nebula allows you to execute both DML and DDL statements supported by GridGain/Apache Ignite. See the SQL Reference guide for details.
To execute a SQL statement, click the + icon in the queries tab bar and select SQL query from the dropdown list.
Then, enter a statement in the query editor, and click Execute.
You can also select a statement you need out of a longer query and Execute statement instead.
The query results are displayed below the query editor. You can copy all results in the table by clicking ⋮ in the results tab and selecting Copy. Alternatively, you can use the context menu for the row to copy a single row of results.
Advanced Settings
GridGain Nebula provides a number of additional options that are not required for simpler queries. Click the cogwheel icon to open the Advanced Settings panel.
Selecting a Schema
You can set the schema for SQL statements in the Default schema field. The drop-down field contains a list of existing schemas. Nebula uses the schema that you selected in the Default schema field to resolve any unqualified reference that is included within any SQL statement that is executed on the tab. Refer to the Understanding Schemas page for more information about schemas in GridGain.
Non-Colocated Joins
Allow non-collocated joins. Set this flag if you want to execute a join query that joins tables on a non-affinity key. If you don’t set the flag, the results of the query might be incorrect. Refer to this section for details.
Join Order
Enforce join order. This option enforces GridGain to use the order of joins as the order is specified in the query, rather than to rely on the optimizer. The optimizer cannot always determine the best order. Refer to this section for details.
Lazy Loading
Lazy result set. You set this flag to lazily load the results of the query. Use of this flag can help to prevent OutOfMemory exceptions that may occur when the result set is too large. Refer to the Lazy Result Loading section for details.
Executing Queries on a Specific Node
In a multi-node cluster, the data that is held in a table is distributed among all server nodes. When you run a SQL query, the query is distributed among the nodes in a map-reduce manner. However, you can limit the scope of the query to a specific node. If you limit the scope, the query is run against the data that is held on the specified node.
Click Select particular node, and, in the dialog box that appears, you select the node.
Using the Explain Statement
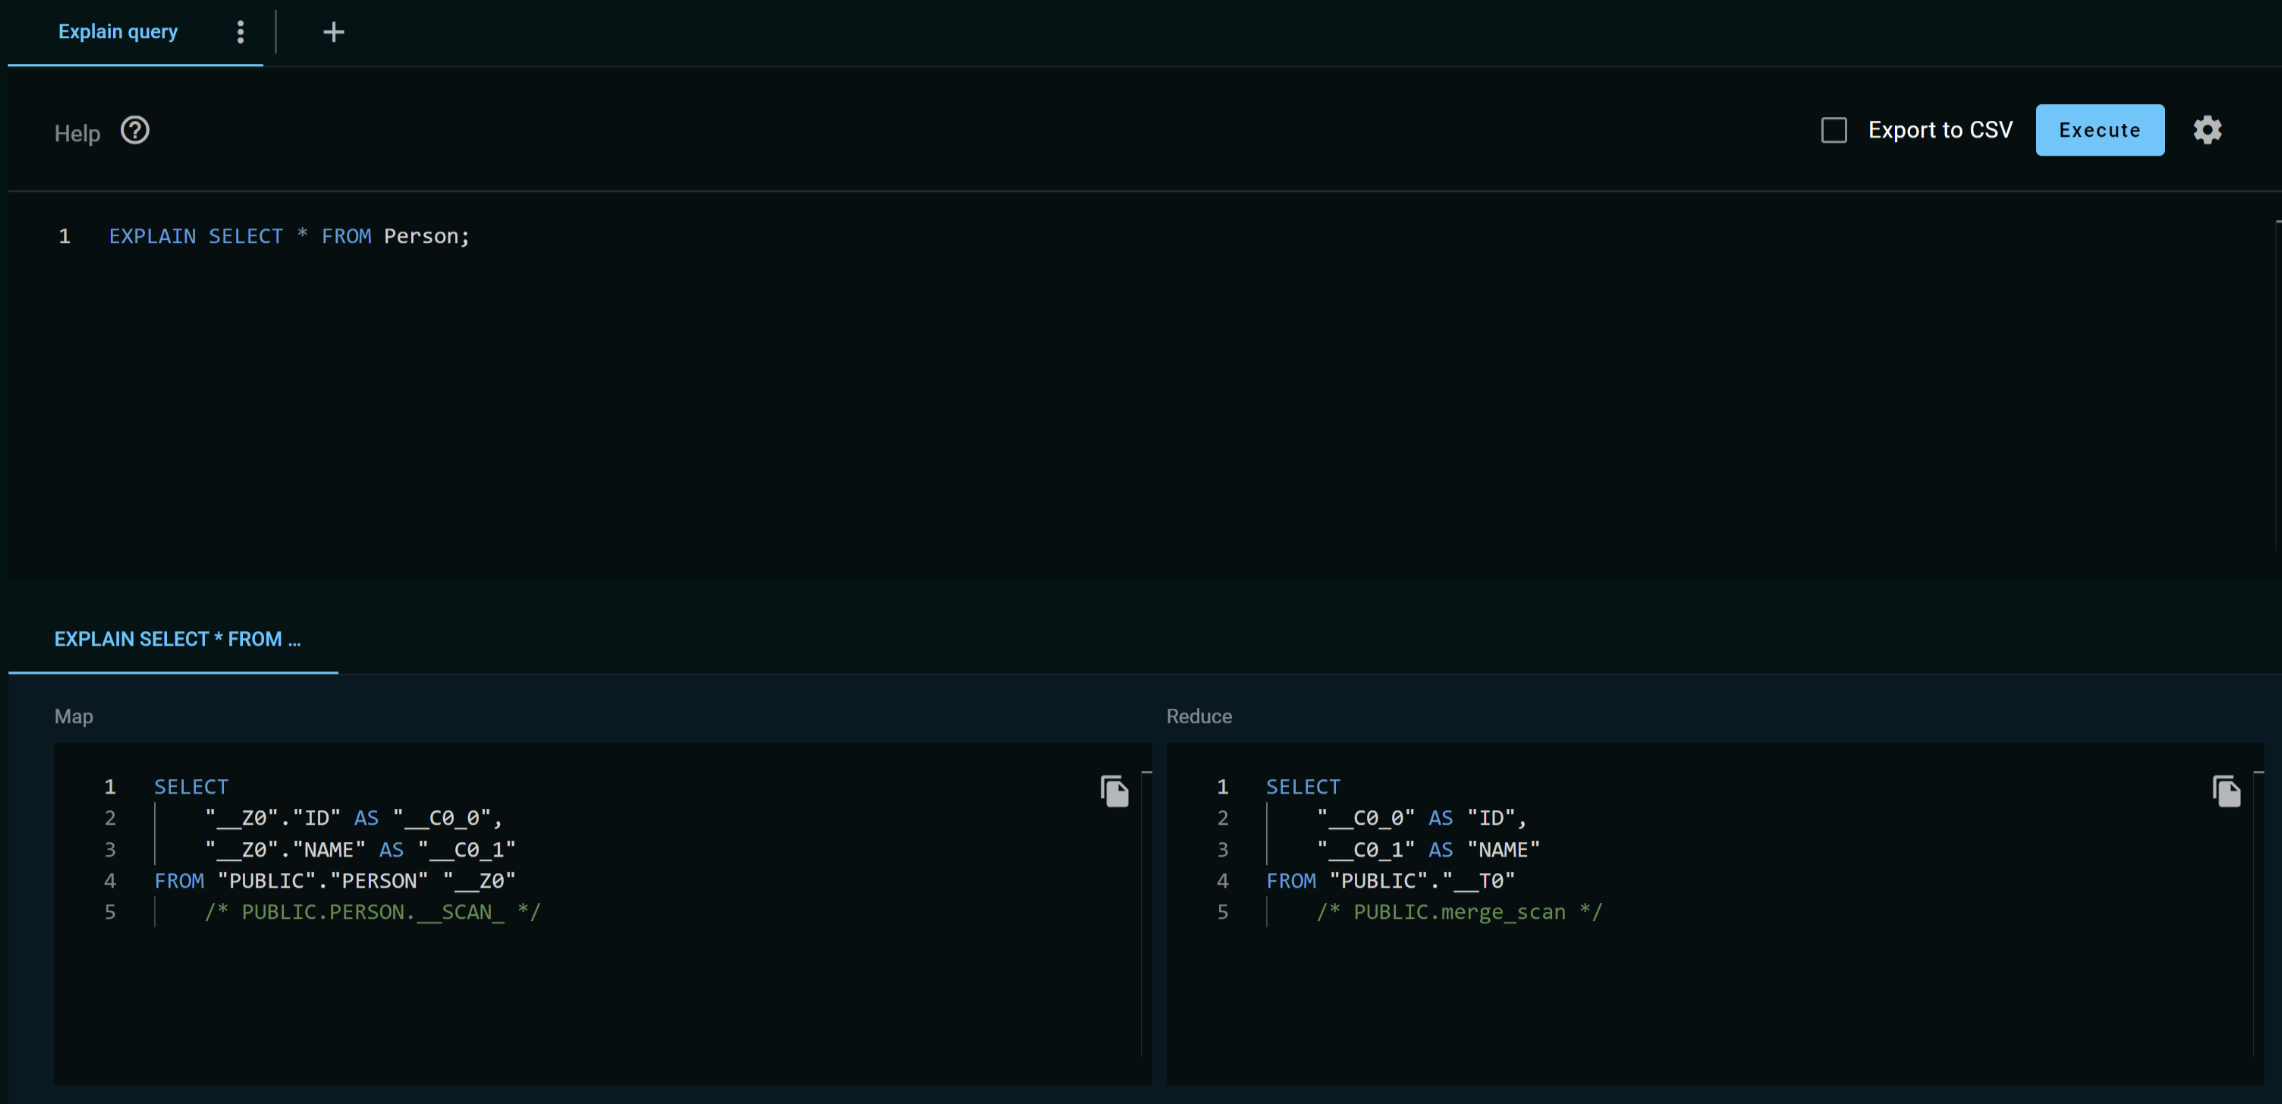
You can use the EXPLAIN statement to view the execution plan for a SELECT query.
The execution plan can help you to analyze the query for performance optimization.
Simply add 'EXPLAIN' at the beginning of the statement and click Execute.
Distributed queries are executed in a map-reduce manner. The execution plan consists of two parts: the map query (the query executed on each node with data) and the reduce query (the "reduce" part, which is performed on the node that initiates the query, the coordinator node).

Scan Queries
GridGain Nebula allows you to execute scan queries - simple search queries used to retrieve data from a cache in a distributed manner. When executed without parameters, a scan query returns all entries from the cache.
To execute a scan query, click the + icon in the Queries list tab bar and select Scan query from the dropdown list, then select a cache to query from the Choose cache list.

Alternatively, you can select the Run scan query option from the context menu for a specific cache:
-
In the Search tree on the left, or
-
In the Caches screen.
Once the cache is selected, the scan query runs with all the advanced options set to default values. The query result is displayed at the bottom of the Queries list tab.

Advanced Options
To run your scan query with advanced options:
-
Open the Advanced settings section by clicking the Expand triangle next to the label.

-
To limit the query to a specific node, click Select particular node and pick the required node in the dialog that opens.
-
To limit the query to a specific partition, type its ID in the Partition number field.
-
To use regex filters, define Key and Value regular expressions.
-
Click Execute.
Miscellaneous Functions
-
To export the query results to a CSV file, select the Export to CSV check box.
-
Use the query tab’s context menu to:
-
Rename the tab
-
Remove the tab
-
Copy the tab
-
Running Queries
The Running queries tab displays all the tracked queries.
| Column | Description |
|---|---|
Type |
|
Type |
The type of query |
Query |
The query |
Reducer |
Reducer node |
Schema |
The schema |
Status |
The query status: Running, Finished, etc. |
Start Time |
The time that the query started |
Duration |
The duration of the query |
The Filters pane, on the right, enables you to granularly define what queries should be included in teh list. The Query type field is a drop-down list where you can select a single specific type or ALL for all types to be included.
Stopping Queries
You can stop a running query by pressing ⋮ and selecting Kill query.
Explaining Queries
For all running queries, you can see an expanded query description by pressing ⋮ and selecting Explain query.
Query Statistics
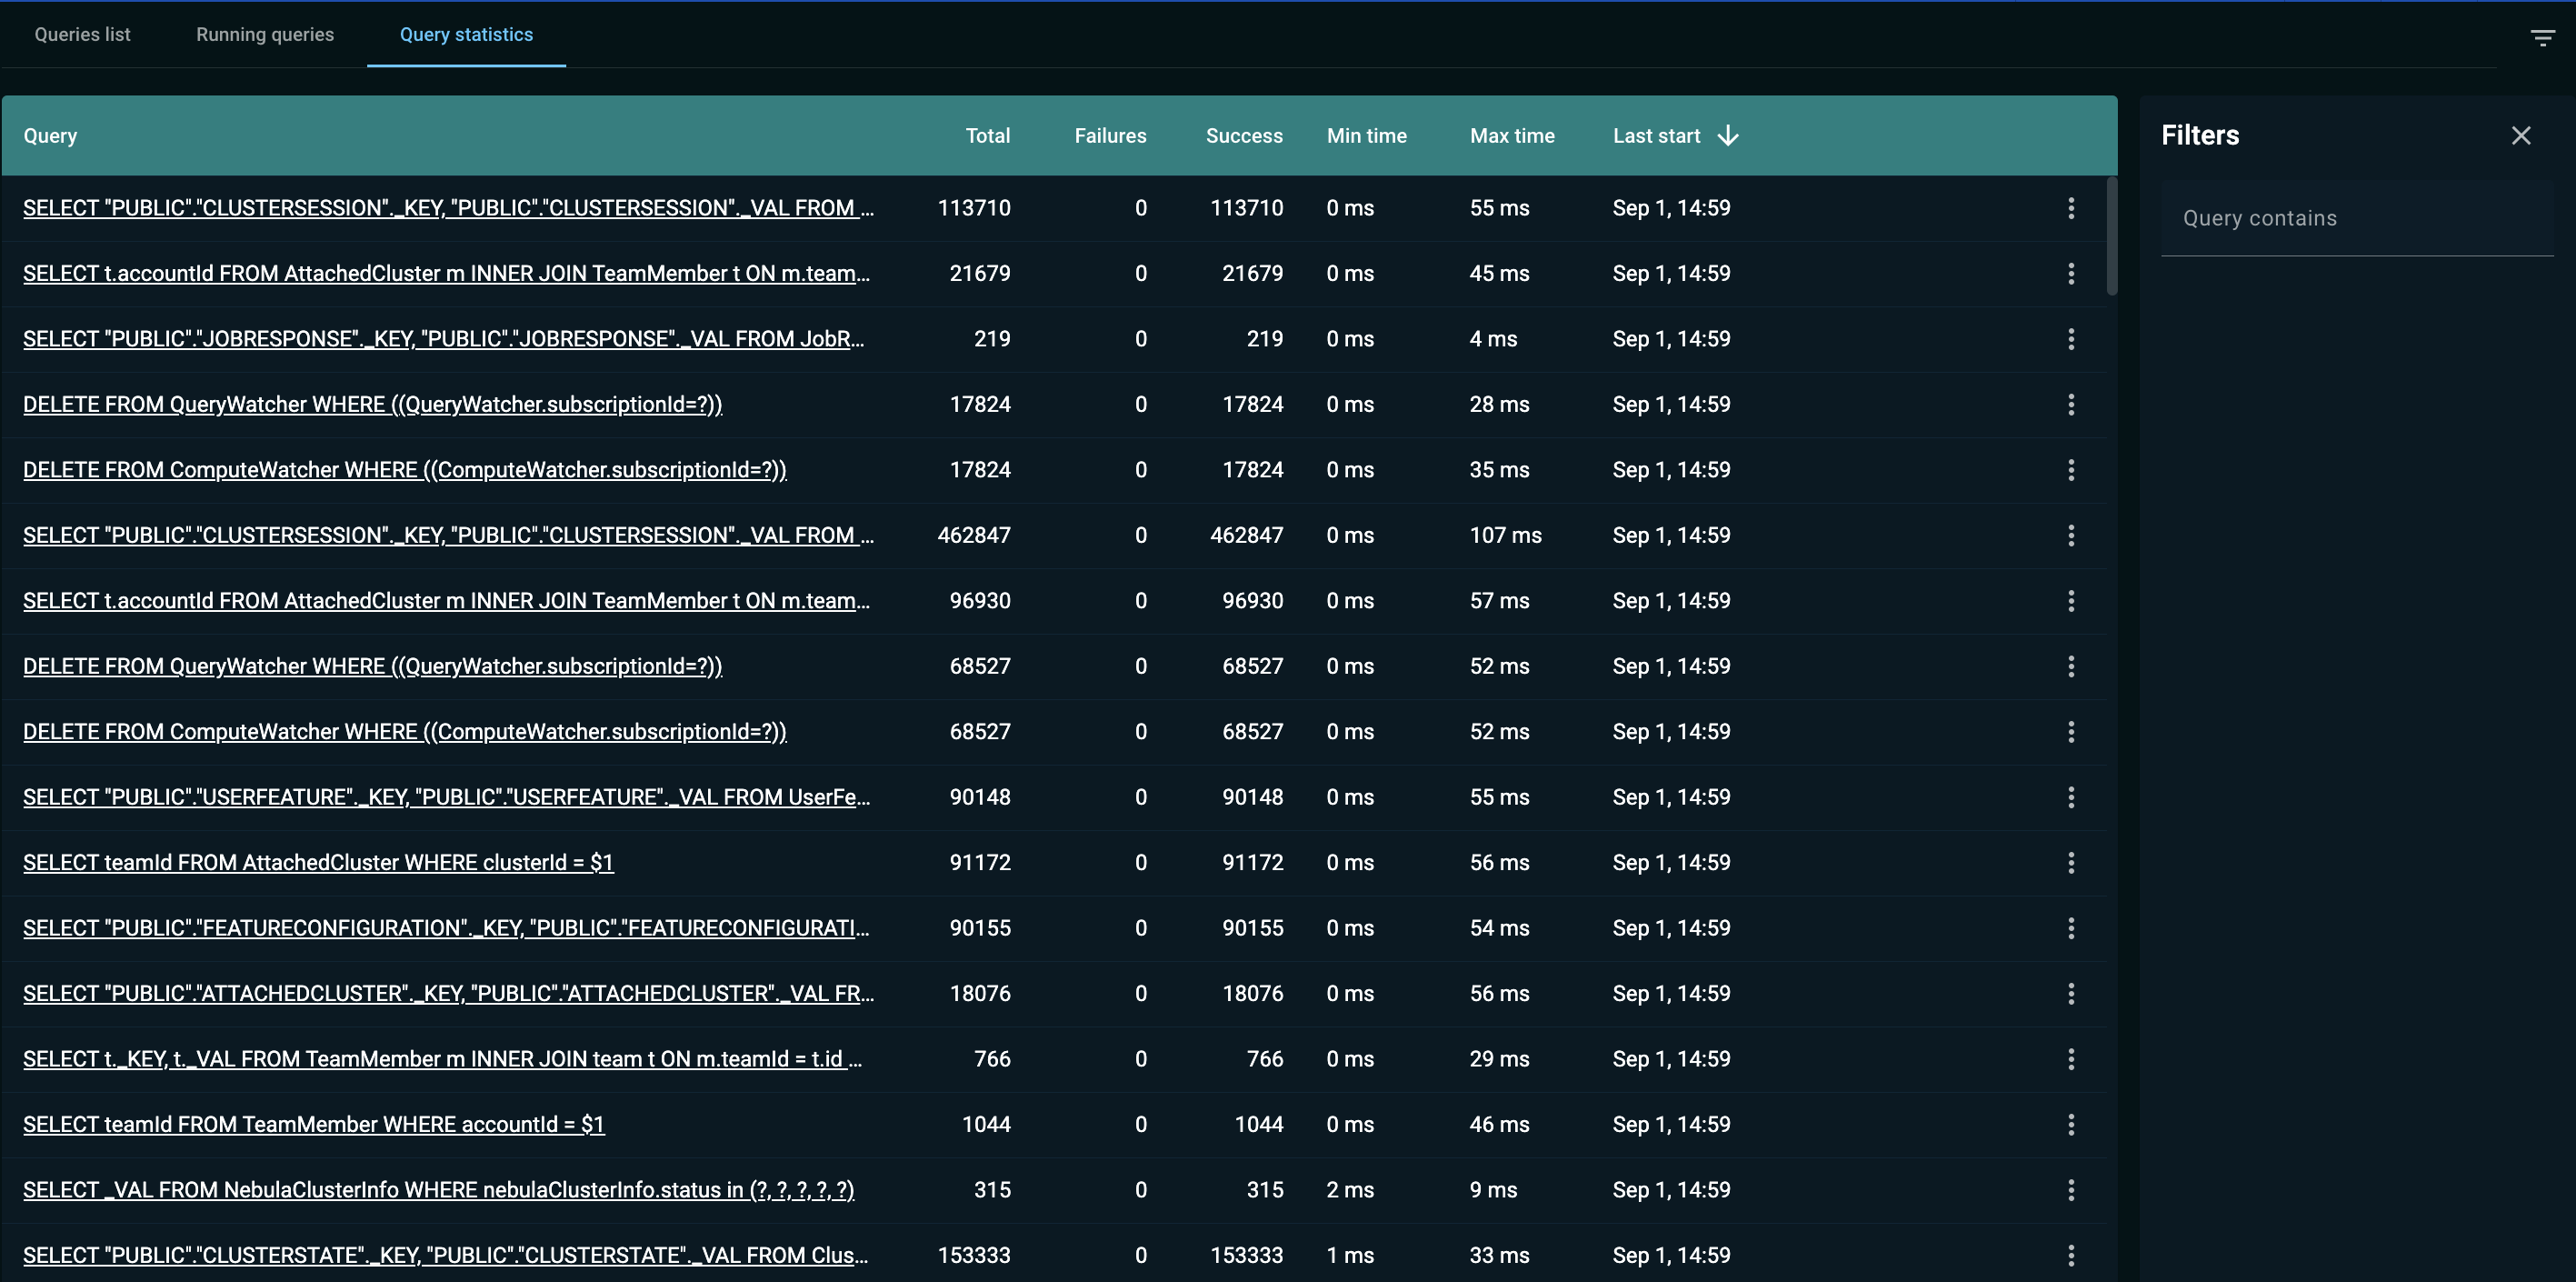
The Query statistics tab displays statistics on the queries that have been executed in the cluster. The list includes the queries that where executed via Nebula and also via other tools.
The list is limited to the most recent 1000 queries.
The statistics includes the following:
-
how many times the query was executed
-
how many times the query failed or succeeded
-
what were the minimum and maximum execution time
-
when the query was most recently executed

You can find the queries that match a specific text string by using the Filters field. Simply enter the text in the input field, and the list is filtered as you type.
© 2025 GridGain Systems, Inc. All Rights Reserved. Privacy Policy | Legal Notices. GridGain® is a registered trademark of GridGain Systems, Inc.
Apache, Apache Ignite, the Apache feather and the Apache Ignite logo are either registered trademarks or trademarks of The Apache Software Foundation.
