Tracing
Overview
There are many different types of SQL transactions: pessimistic, optimistic; different isolation levels and so on. However, in general, the longer a transaction lasts, the more it affects the overall performance of the system.
For more details, spend less than 5 minutes watching the video below.
Metrics cannot intercept all problems with your transactions, so you can look into the tracing section.
Each trace contains a group of spans. Span is a particular activity in the distributed system. You can look into each recorded transaction. If your transactions are long and there are big gaps in diagrams, but the actual operation happens at the very end, there is most likely something wrong with your code. To debug it, you can expand the root span and see general information about the trace.
Here are some common cases:
-
There is a method that parses multiple caches, and a different method for attaching results to an external account;
-
There is an annotation in the method that slows down the process;
-
There is a call to an external API, which can respond with delays if it is heavily loaded;
-
There is a validation that the external account is not null that leads lead to a rollback of the transaction on exceptions.
After you identify the cause for the delay, you can remove its cause and improve transaction speed.
The Tracing Screen
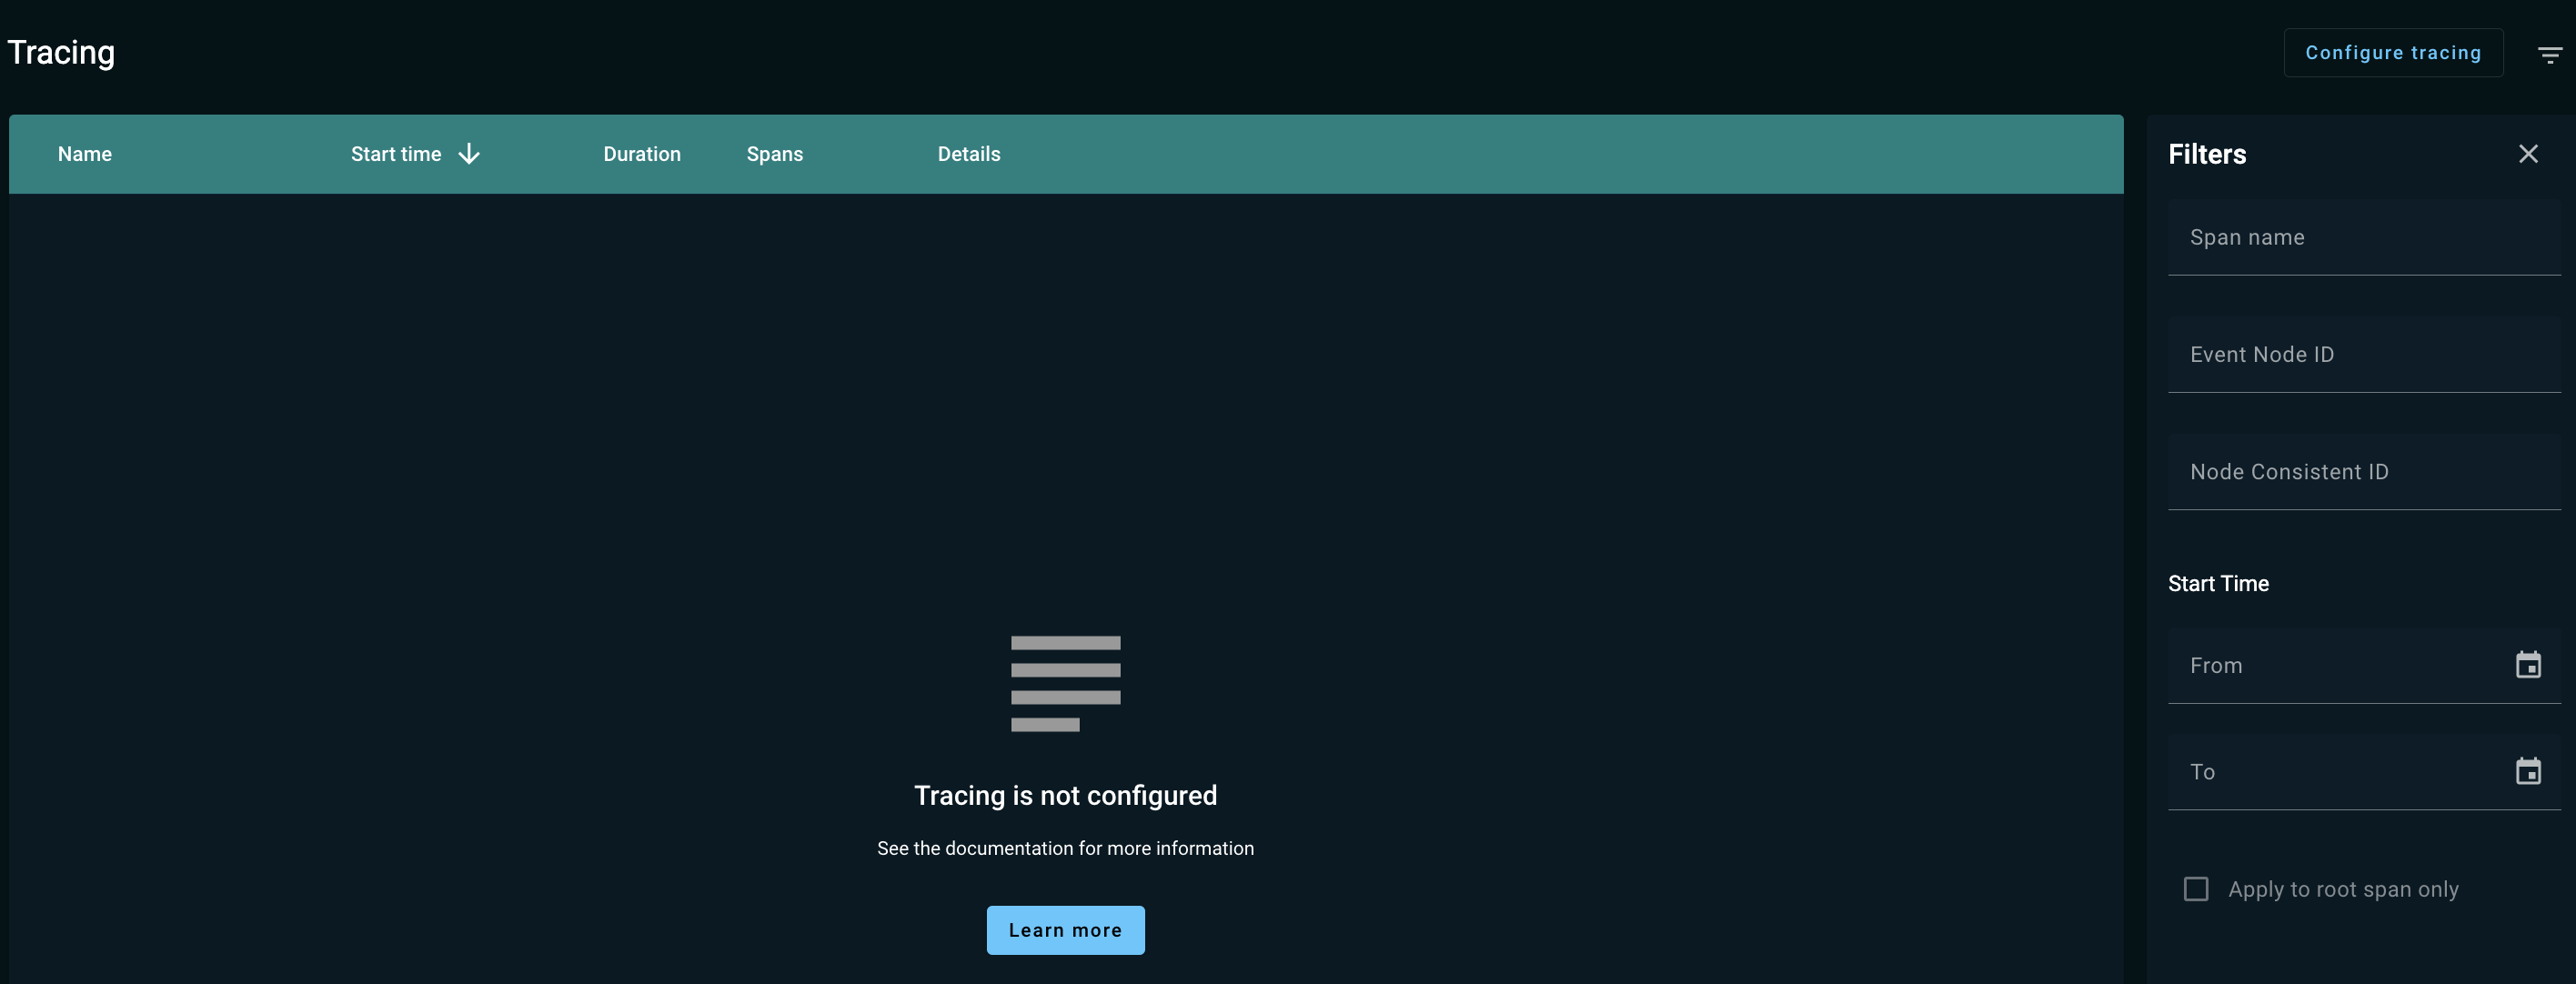
The Tracing screen displays information about traces recorded during cluster operation. You need to enable tracing. The recorded information can include informational messages, error messages, duration of specific operations, stack traces, etc. You can use this information to troubleshoot cluster operation or identify latency issues.
The screen displays a table containing all recorded traces, including the name of the event, its start time, duration and number of spans.

A trace is recorded information about the execution of a specific event. Each trace consists of a tree of spans. A span is an individual unit of work performed by the system in order to process the event.
A trace can include spans from multiple nodes.
Configuring Tracing
To configure tracing:
-
Click the Configure tracing button in the upper right corner of the page.
The Configure tracing dialog appears.

-
Choose one or several Included scopes from the drop-down list for each scope.
-
For each of the selected scopes, specify a percentage in the Sampling rate field.
-
Click OK for the changes to take effect.
Viewing Spans
A span contains a set of tags and a set of logs attached to it. A tag is a key-value pair with information about the span. A log is a key-value pair with information about a specific moment or event within a span.
In the configuration section you can set the “scopes” of transactions you want to track. For example, you can track “cache reads” and “cache writes”, communication between nodes, transactions, and so on.
© 2026 GridGain Systems, Inc. All Rights Reserved. Privacy Policy | Legal Notices. GridGain® is a registered trademark of GridGain Systems, Inc.
Apache, Apache Ignite, the Apache feather and the Apache Ignite logo are either registered trademarks or trademarks of The Apache Software Foundation.
